Brooklyn Boro

OPINION: Stable immigration patterns help make Brooklyn No. 1
April 5, 2017 By Raanan Geberer Special to the Brooklyn Daily Eagle
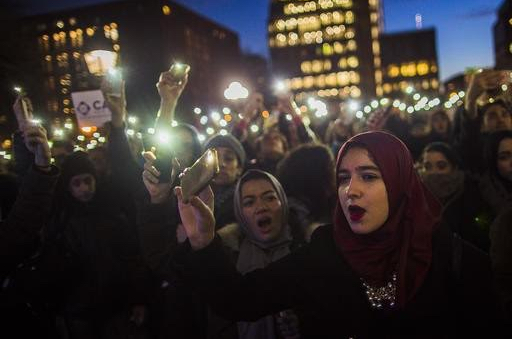
Muslim women rally for immigrant rights earlier this year in Manhattan. AP photo by Andres Kudacki
Share this:

Brooklyn is No. 1 — in population within New York state, that is. And immigration has a lot to do with it.

According to recently released figures for 2016 from the U.S. Census Bureau’s U.S. Population Estimates, there were 2,629,150 people in Kings County last year, more than in any county in the state. This represents an increase of about 5,000 from 2015, when estimates showed a population of 2,624,951 for Brooklyn.

In fact, Brooklyn’s estimated population has increased year by year since the 2010 overall Census survey, which showed 2,504,700 people living in the borough. This represents a 5 percent increase in population. Only the Bronx, with 5.1 percent, had a larger increase in people over the six-year period.
Subscribe to our newsletters

During the same period, the number of people who moved to or from Brooklyn domestically was minus-169,064, meaning that overall, that many more people left Brooklyn for other parts of the U.S. than came to Brooklyn from elsewhere in the country.

Internationally, however, Brooklyn saw a net gain of 136,787, representing people who came to the borough from other countries. Therefore, the slow but steady rise in Brooklyn’s population is more a result of the large number of immigrants coming here from all parts of the globe than it is of any large influx of young professionals and artists coming here from the Midwest or the West Coast, although, of course, this is also an important trend.

Thus, in terms of overall population movement, however, East Flatbush, Sunset Park and Bensonhurst are far more typical of the borough as a whole than Williamsburg or Greenpoint.

There are also certain variables that the Census Bureau doesn’t provide for 2016 but did provide for 2015 and 2010 — for example, racial and ethnic origin. The Latino and African-American populations changed very little: from 19.8 percent in 2015 to 19.5 percent in 2010; and from 34.3 percent in 2010 to 34.8 percent in 2015, respectively.

The Asian population grew slightly, from 10.5 percent in 2010 to 12.4 percent in 2015. The non-Hispanic white population was also basically stable, increasing from 35.7 percent in 2010 to 35.9 percent in 2015.

Since the white, African-American, Latino and Asian populations all showed little percentage change, that tells me that many people and/or their family members are staying in the borough and that patterns of immigration are basically the same as they were at the beginning of the decade. While the statistics provided don’t break down immigration to Brooklyn, most observers know where large numbers of Brooklyn immigrants hail from: China, Mexico, Central America, the Caribbean, the countries of the former Soviet Union, the Mideast and more.

The Census statistics also allow us to look at the borough’s population by age. In 2010, 23.7 percent of the borough’s residents were under 18; in 2015, that figure had lowered slightly to 23.2 percent. The percentage of seniors 65 and older went up slightly, from 11.5 percent to 12.3 percent.

All in all, these figures show a basic stability in the borough. And immigrants from all over the world are contributing to that stability.


Leave a Comment


Leave a Comment