Brooklyn Boro

Census survey: Brooklyn’s mainly middle-class, with many immigrants

High levels of education, health insurance

December 27, 2013 By Raanan Geberer Brooklyn Daily Eagle
Screen Shot 2013-12-30 at 9.44.29 AM.png
Share this:

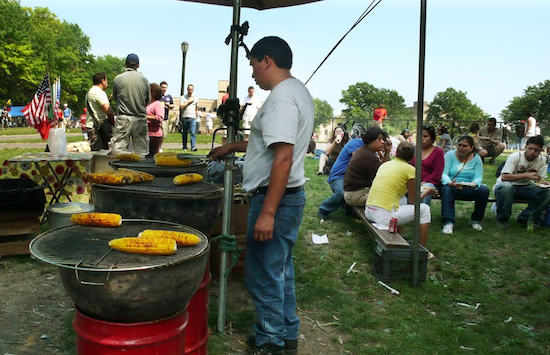
The Census Bureau’s latest American Community Survey (ACS) results are online, and they reveal Brooklyn residents to be mainly young or middle-aged, fairly well-educated and largely middle class.

The survey also reveals that Brooklyn has a fairly even balance of different racial and ethnic groups, with no group having a huge majority. One surprise, however, is the percentage of foreign-born – almost 40 percent.

The ACS is an ongoing survey focusing on demographic, housing, social and economic information. The government started it partially because fewer and fewer people wanted to fill out the “long form,” which asked for such data, during the “regular” 10-year census. The Census Bureau began collecting data for the ACS in in 2005 and started reporting its results in 2006.
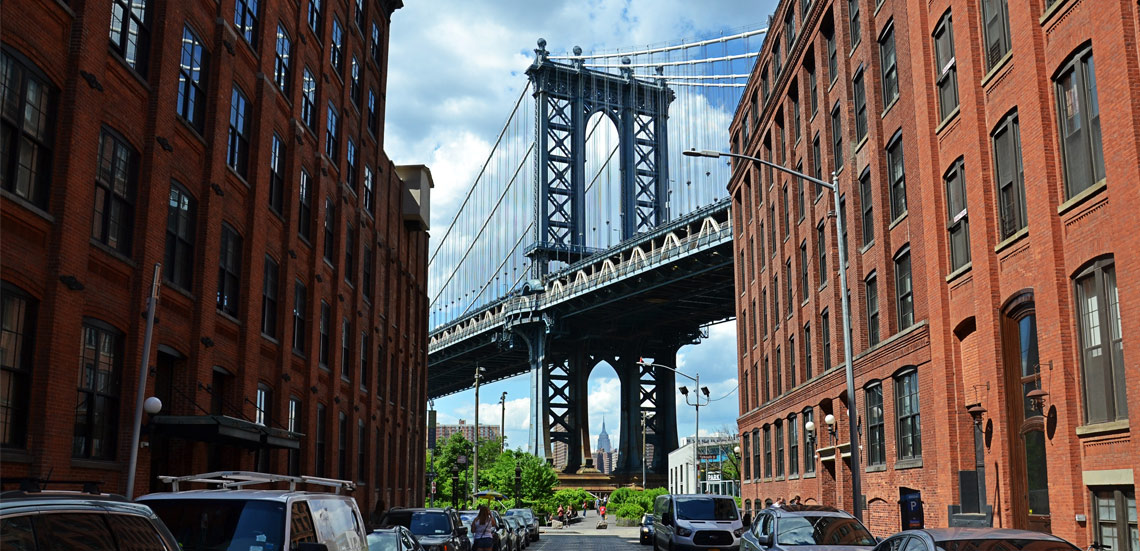
Subscribe to our newsletters

As far as education is concerned, according to the latest ACS figures, 78 percent of all Brooklyn residents have graduated from high school, while 29.8 percent have received a bachelor’s degree or higher. Only 2.8 percent of the civilian population are veterans, although that amount would certainly have been higher after World War II, the Korean War or Vietnam.

Despite the large number of “transplants,” Brooklynites in general tend to stay put, according to the survey. Ninety percent of the borough’s residents live in the same house they lived in a year ago. Immigration, however, is as strong as ever: only 62.5 percent of all Brooklynites were born in the U.S., while 37.5 percent are foreign-born. Of the latter group, 97.5 percent came to the U.S. before 2010. Even counting only those people who have been in the borough for more than five years, 46.2 percent speak a language other than English at home. Spanish is the most common one.

The largest number of immigrants, 51 percent, came from Latin America, followed by 25.1 percent from Asia and 20.2 percent from Europe (of these, Russians are a large percentage). One of the biggest indication of changes in Brooklyn’s demographics can be seen in the table called “Occupation” The largest category, with 37 percent of all workers, is “management, business, science and arts occupations.” The second largest, at 24.6 percent, consists of those in “service occupations” (mainly retail); and the third-largest is made up of those in “sales and office occupations,” with 23.3 percent. Years ago, industrial workers would have been the largest category.

All in all, most Brooklyn residents who are still in the labor force and not receiving benefits are working. The unemployment rate is 7 percent — about the same as the nationwide jobless rate. Sixty percent of all workers take public transportation, with 19.5 percent driving to work.
Now, we get to household income, The most common categories are $50,000 to $74,999 (16.7 percent), $35,000 to $49,999 (12.8 percent) and $75,000 to $99,999 (10.2 percent).

Thus, even though lots of people are buying expensive new condos, they’re still a minority. In fact, 12.5 percent of Brooklynites have received food stamp benefits during the last 12 months, and 20 percent of Brooklyn families are living below the poverty level.
But all in all, most Brooklynites are middle-class. And here’s one fact that should be applauded: 86.5 percent of all Brooklynites have health insurance coverage.

Age-wise, the largest group among Brooklynites consists of those 25 to 34 years old, or 17.5 percent (possibly evidence of all those young people coming to areas like Bushwick, Greenpoint and Williamsburg). The second largest age group consists of people 35 to 44 years old, at 13.7 percent. Those over 65 – indeed, those over 55 – are in the single digits. (Maybe they moved to Florida.)

The racial breakdown shows that in Brooklyn, no one group overwhelms the other. Some 45 percent of residents are white, 11 percent are Asian and 35 percent are African-American, with the rest “other” (for example, Native American). Of the total population, Latinos of any race are 19.8 percent.


Leave a Comment


Leave a Comment